.svg)


Fund Flow Indicator
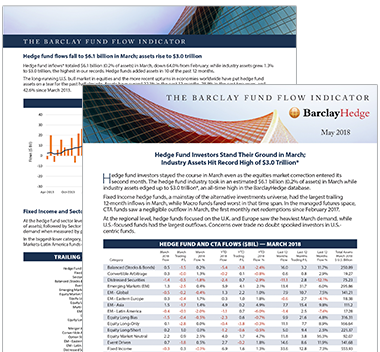
Cash flowing into and out of hedge funds reveals essential clues on investor sentiment and the success of individual fund strategies.
Every month, the Barclay Fund Flow Indicator tracks the assets and flows into the entire industry and subdivides them into funds of funds, CTAs and 19 distinct hedge fund strategies. We also report on flows into funds covering Europe, Asia and the Americas.
The studies are available for download to all BarclayHedge members. Membership is free, click here to register, or ensure you are logged-in.