<img height="1" width="1" style="display:none;" alt="" src="https://px.ads.linkedin.com/collect/?pid=2893641&amp;fmt=gif">

MAP Software

Border

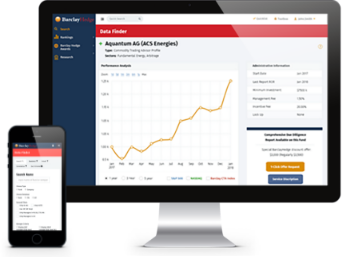
Barclay’s Manager Account Planner (MAP) software provides a comprehensive suite of analytic tools that allow subscribers to evaluate and analyze the data on hedge funds and CTAs found in the Barclay databases. This powerful tool is used in the process of selecting advisors for proprietary capital, for public or private funds, and for personal portfolios.

  • Powerful Ranking Tools – Easily view the entire database or any sub-universe of your choice while simultaneously viewing contact, account and statistical information on individual programs. Rank your program selections by a variety of relevant statistics or industry benchmarks.
  • Correlation and Regression Analysis – Run correlations on multiple trading programs and indices or generate up, down or rolling correlations. Generate Regressions for any index or program against an individual or group of programs.
  • Profile Analysis – Evaluate any trader on the basis of rolling ROR, standard deviation, or a ratio of these two statistics for a user-specified time period and/or chart these values against the average values generated by a user-defined subgroup.
  • VAMI and Rolling Analysis – Create standard and normalized VAMI charts. User can choose from ten Rolling Analysis reports and charts with window size from 3 months to 120 months.
  • Style Analysis – Measure and understand where the returns of an active Manager are coming from.
  • Powerful Optimizer – Create multiple Optimization scenarios for highest reward/risk, lowest volatility or return for targeted volatility for a variety of optimization reports.
  • Efficient Frontier – Calculate efficient frontiers and instantly view the results in a chart or in tabular format.
  • Customize MAP to Fit Your Needs – MAP’s user-defined parameters allow for tailored selection and analysis of relevant data. Users can browse the entire database or a specialized sub-universe based on markets traded, trading style, track record length, date restrictions, string searches, and/or user-defined categories.
  • Informative Charts and Reports in MAP
  • Program/Manager Details Report
  • Drawdown Report
  • Performance History Report
  • Time Windows Report
  • Address Book
  • Ranking Reports
  • Distribution of Monthly Returns Report/Chart
  • Profile Analysis
  • Floating Bar Charts
  • Scattergram Charts
  • VAMI Charts
  • Portfolio Performance Summary Report
  • Barclay Institutional Report (BIR)
  • Correlation Reports
  • Regression Reports
  • 10 Rolling Analysis Reports
  • Efficient Frontier Report/chart
  • Optimization Reports
  • Optimization Curves
  • Rolling Optimizations

Interested in getting MAP Software?