.svg)


Managed Futures (CTA) Database

Diversify your knowledge of managed futures and commodity trading advisors (CTAs). Sort, compile and compare 1,057 CTAs and drill down with more than 350 unique fields per fund. Get in-depth, granular detail on traders’ performance, leverage, and long/short exposure, and create robust custom reports with our FundFinder Pro software. Contact information for key principals.
You’ll see why BarclayHedge is the industry standard for comprehensive, accurate and powerful CTA data.
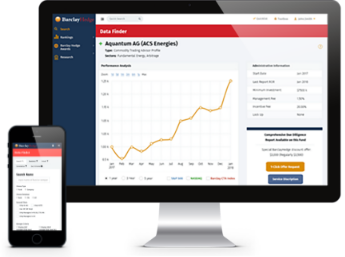
BarclayHedge ProAccess
Access in-depth knowledge on the firms, strategies, performance and investments with BarclayHedge ProAccess. Leverage the advanced analytics tools in FundFinder along with complete access to BarclayHedge research reports and exclusive articles for members only.