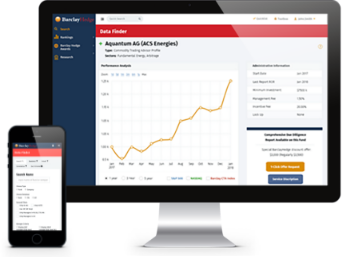
Logo Hedge Fund Data

Barclay’s Single Manager Hedge Fund Database
contains comprehensive information on 2717
single manager hedge funds.

Hedge Fund Data

Valued at USD 3,500 for an annual subscription, the Barclay Single Manager Hedge Fund Database is a comprehensive and up-to-date downloadable database specific to single manager hedge funds.

104 unique quantitative and qualitative fields per fund combine to give you more than 300,000 individual data points for your analytic purposes. Up-to-date monthly returns are maintained with an average update frequency of 92% within 30 days.

Designed to assist successful investors and money managers in keeping abreast of an evolving market, the Barclay Single Manager Database includes scores of fields not available in competing products.


“In my opinion your database is one of the highest quality databases on hedge funds.”
 
Dr. Robert Kosowski
Assistant Professor and Director of Centre for Hedge Fund Research
Imperial College Business School
Imperial College London


Ask us a question about the Single Manager Database
CLICK HERE 


“BarclayHedge has been a valuable resource to us in the growth of our firm…”
 
J.D. Hurd / President / Rocket Capital Management


New Functionality:
Downloadable Data Integrated With Online Reports

Online reports provide users with the most current hedge fund data in a user friendly format. Use Excel to sort and filter the entire Single Manager Hedge Fund Database to find funds that match your criteria, then click on fund names and download professional, easy to read, 8 page reports with the most up-to-date information.

Download a sample to see how this new functionality works. Learn more about DataFinder Pro in our Frequently Asked Questions.
 

Key Benefits

  • Depth: 104 unique data fields that can be queried allow you to stay a step ahead of the market.
  • Functionality: Store and use the complete database on your PC. Sort and filter any field or combination of fields; a truly relational database providing fund IDs, manager IDs and both vertical and horizontal monthly data points.
  • Accuracy: Reported direct from the source; refreshed twice each month with new fund additions, updated performance and assets, and important changes to fund and manager data.
  • Transparency: Disclosure of holdings, allocations, fees, performance, assets, key contact persons, direct email addresses and more.
  • Compatibility: Immediate download. Choose from Microsoft Excel (spreadsheet) or Access (table) formats.

For Investors

Enhance and streamline the due diligence process and avoid potentially costly mistakes. Easily sort and filter any field or combination of the 104 quantitative and qualitative fields to compile a selection compatible with your objectives. Facilitates in-depth style and sector analysis, portfolio optimization and stress testing. Discloses underlying holdings, portfolio allocations, fees, investment minimums, historic monthly performance and assets, objectives, direct contact information and much more.

For Researchers

Get results quickly. Gain insight into key strategies, tactics and core competencies. Benchmark your fund or strategy and compare and contrast against relevant peer groups that you define and create. Sort, filter and compare any field or combination of fields on your PC and export results directly to third-party applications. Key contact persons, job titles, direct emails and accurate data points ensure you get the best return on your subscription investment.

Fund Information

  • Legal name, domicile, status, inception date, currency and current assets in US Dollars
  • Investment minimums, accepted investor types, management, performance, redemption and other fee structures, subscription and redemption frequency and notice periods, lock-up periods, hurdle rates and high water mark
  • Investment objectives and unique features, primary, secondary and tertiary strategies and risk appetites, asset class and in-depth geographical exposure and focus, exchange listing and structural information
  • Reporting style, use of leverage and options, long and short exposure, primary and secondary benchmarks, margin/equity ratios, frequency of trading, last audit and K1 status
  • Monthly performance and monthly assets growth time series in both horizontal and vertical formats for ease of analysis
  • Underlying holdings, portfolio allocations and instruments by name strategy and percentage of NAV
  • Fund administrator, advisor, custodian, prime broker and auditor, including key contact persons with phone number

Manager Information

  • Firm name, domicile, complete postal addresses, number of employees, website and general email address
  • Principals, key contact persons and biographies, job titles, direct emails, phone and fax numbers
  • Assets under management, SEC/NFA registration details

Current Database Snapshot

General
Global Hedge Fund FoF CTA Single Hedge Contact
Number of reporting funds 5677 4678 1961 999 2717 20840
Number of reporting management companies 2149 1565 391 584 1174 8317
Number of funds added this month 20 20 16 0 4 20
Number of funds added in previous month 174 135 36 39 99 174
Annual refreshes 24 24 24 24 24 12
Cost (annual subscription) USD 6,000 USD 4,500 USD 2,000 USD 3,000 USD 3,500 USD 4,500
Distribution
Managers domiciled in USA 61.10% 60.19% 48.08% 63.53% 64.22% 64.04%
Managers domiciled in Europe 23.22% 23.26% 37.60% 23.12% 18.48% 19.91%
Managers domiciled in Caribbean 11.49% 12.33% 8.95% 9.25% 13.46% 3.99%
Managers domiciled in Rest of World 4.19% 4.22% 5.37% 4.11% 3.83% 12.06%
Funds domiciled in USA 34.49% 27.17% 16.27% 68.77% 35.04% 30.30%
Funds domiciled in Europe 16.47% 19.11% 30% 4.10% 11.23% 18.22%
Funds domiciled in Caribbean 44.57% 50.56% 52.22% 16.52% 49.36% 36.01%
Funds domiciled in Rest of World 4.47 % 3.16% 1.48% 10.61% 4.38% 15.47%
Fund Update Summary(Real Time)
% of Funds With June Returns 11.71% 5.90% 0.86% 37.02% 9.55%  
% of Funds With May Returns 95.77% 95.40% 94.31% 97.40% 96.18%  
Performance Reporting for - June 2009
Funds with positive ROR 50.07% 63.18% 70.59% 40.95% 62.69%  
Average positive ROR 2.80% 2.48% 0.96% 2.95% 2.59%  
Funds with negative ROR 49.93% 36.82% 29.41% 59.05% 37.31%  
Average negative ROR -2.98% -2.40% -3.28% -3.14% -2.35%  
Average ROR -0.12% 0.68% -0.29% -0.64% 0.75%  
Highest ROR 27.44% 16.52% 3.61% 27.44% 16.52%  
Median ROR -0.01% 0.62% 0.15% -0.65% 0.70%  
Lowest ROR -35.84% -10.71% -7.85% -35.84% -10.71%  
back to top

Home | Privacy | About Us | Blog | Terms of Use | Advertise | Contact Us | © 2009 BarclayHedge, Ltd