.svg)


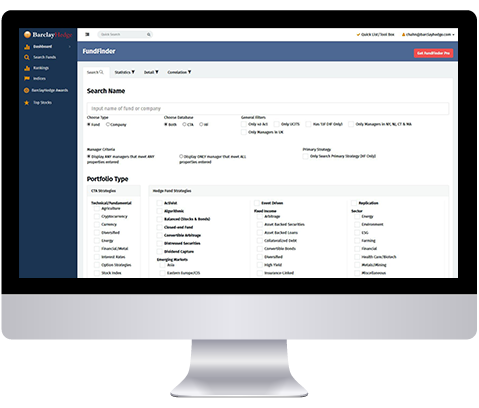
FundFinder
FundFinder is a tool for researching hedge funds, funds of funds and CTAs. FundFinder is accessible to all BarclayHedge members. Membership is free, click here to register, or click here to log in to FundFinder.
FundFinder Pro is available when you purchase a subscription to any BarclayHedge database that contains performance data.
FundFinder Pro has two parts:
- FundFinder Pro is an enhanced version of FundFinder for the database you subscribe to. All the dimmed fields are available, the Portfolio Calculator is enhanced, and the profiles are significantly more detailed.
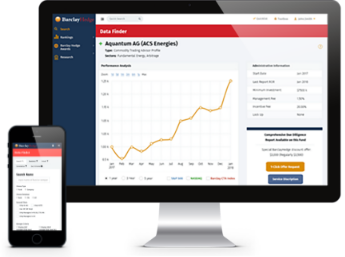
- When you use the BarclayHedge database on your computer, the fund and/or program names are clickable. When you click a fund name, a browser window opens and displays an easy-to-read 8-page report with detailed information about the fund. The “Statistics & Risk” page includes extra calculations that are not in the database, such as the Sharpe ratio.
Have questions on using FundFinder? Check out our FundFinder FAQ.
FundFinder Pro is updated real-time. For a free demonstration, please email barclayhedge-sales@backstopsolutions.com and a representative will be happy to assist.